Spotfire or how to give a meaning to your data

Jean-Baptiste Caillau
Using Spotfire is taking a crucial step beyond the standard spreadsheet. It means a radical shift of mindset
As you are faced with tons of data, you do not want (actually you must not) try to access your data as a collection of sheets made of thousands – or even millions – of rows and columns. What you actually need is the ability to extract relevant information from your data, through relevant computations and visualizations.
Spotfire is tailored for large datasets and advanced computations (including interfacing Python and R codes). It is built to design a collection of analysis and views of your data, while the raw data itself remains at the underlying core level.
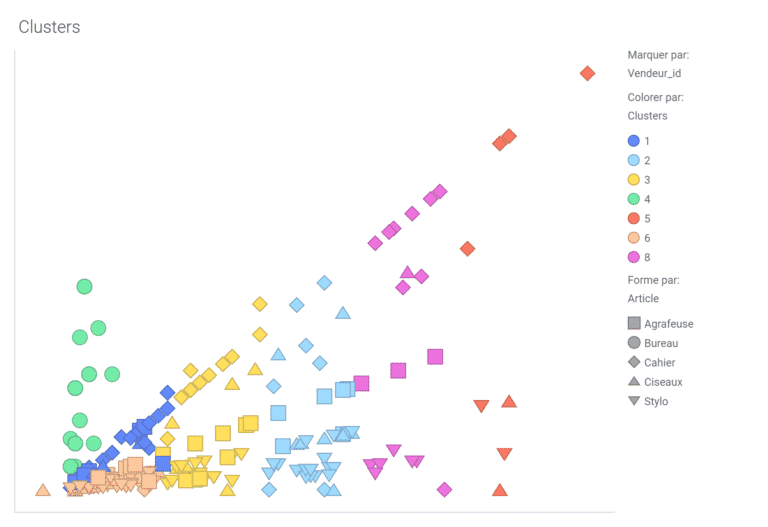
Do not try to delete a row in your sheet, it is part of your data! Instead, tell Spotfire to use it (or not) in the analysis you want to build. Spotfire is capable of producing in a very intuitive way every standard statistic or graphic on your data, and more. It also has a great web client available on your desktop computer, your tablet, or your smartphone.
Last but not least, sharing data and analysis is very easy over the TIBCO cloud.
